To see how to analyse your results in the data portal, watch this video or follow the steps below:
After the measurements have been conducted and processed, the request will be set to completed as shown in the screenshot below.
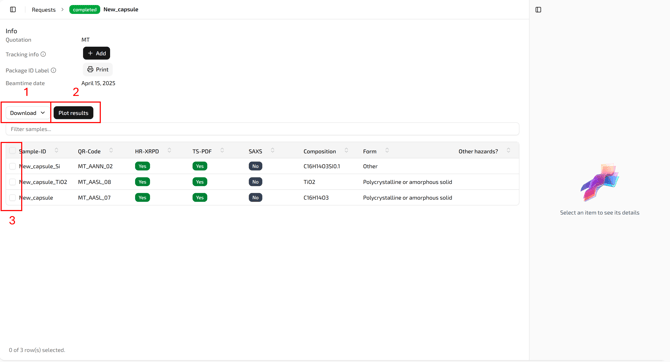
There are now two new options: Download (1) and Plot results (2).
Via the Download menu the data, the supplementary files, and the report can be downloaded.
Information about the data formats we provide can be found in a separate article: https://help.momentum-transfer.com/data-formats
The supplementary files include the reference measurements of LaB6 as well as the refinement files of LaB6 with Topas and PDFgui.
The report contains a detailed description about the measurement conditions, refinement of the reference standard and plots of the measurements.
To have a first look at the data, check the box in front of a sample (3).
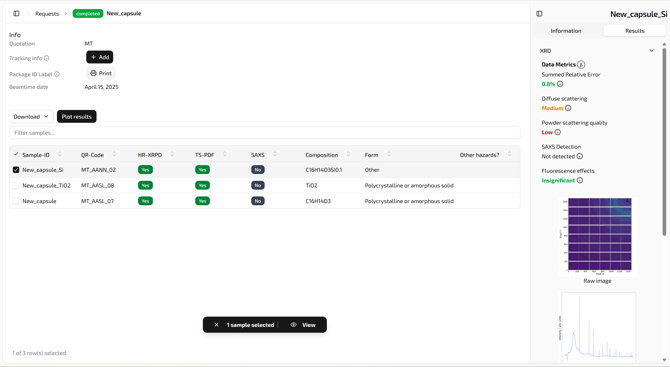
In the right side bar at the top is listed now some information about the data metrics followed by the 2D raw image and plot of the measurement. This is available for all measured methods.
To have a deeper look into the measurements click the Plot results button and a new page will open as shown below:
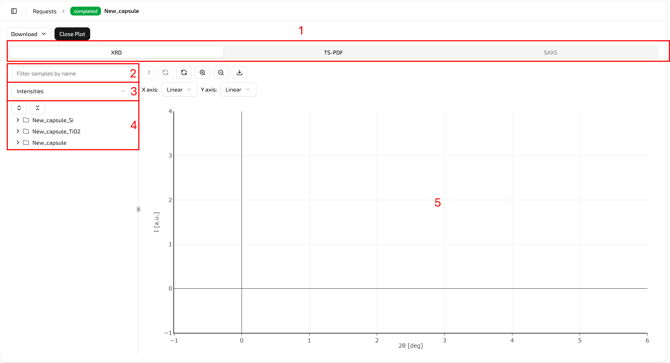
At the top is a menu (1) where the different methods can be chosen (if measured), XRD, TS-PDF or SAXS.
Below at the left side bar is the data tree menu. At the top (2) is a text box to filter samples by name.
Underneath is a drop down menu (3). The following data type can be chosen there:
- For XRD
- Raw - to see the raw 2D images.
- Intensities - to see the integrated patterns I(2θ).
- For PDF
- Raw - to see the raw 2D images.
- Intensities - to see the integrated patterns I(2θ).
- Reduces structure factor F(Q).
- Structure Factor S(Q).
- Pair distribution function G(r).
- For SAXS
- Raw - to see the raw 2D images.
- Intensities - to see the integrated patterns I(2θ).
At the end is the data tree (4), showing a list of the samples in this request which have been measured with the selected method. By clicking at the sample name the data tree will open up and all available data files are listed. To plot them, check the box in front of the file and it will be plotted in the Plot window (5).
For comparison it is possible to select several files, from the same or different samples. Using the mouse you can zoom into the plot. At the top of the Plot window is a menu bar with different buttons:
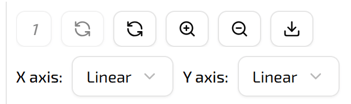
- Normalize the plotted data to one.
- Undo the normalization.
- Restore the original view (after zooming).
- Zoom in.
- Zoom out.
- Download an image of the plot.
In the second row the X and Y axis plotting can be changed from "Linear" to "Log".
Below you find some example plots.
Plotting the raw image: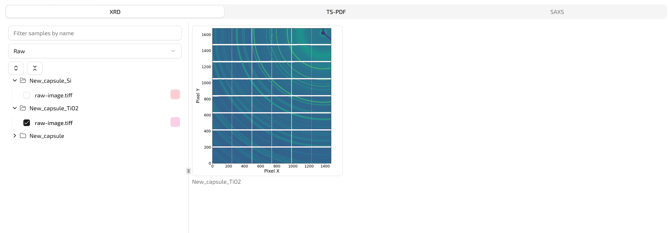
Plotting the powder pattern (XRD):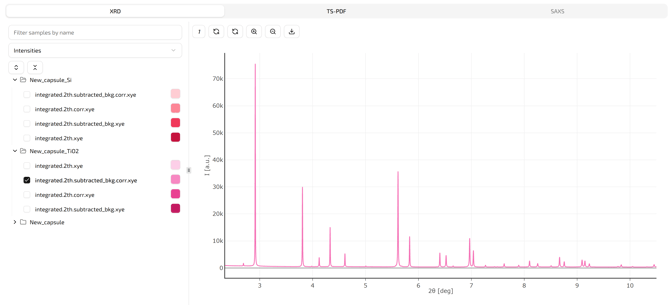
Plotting the pair distribution function (PDF):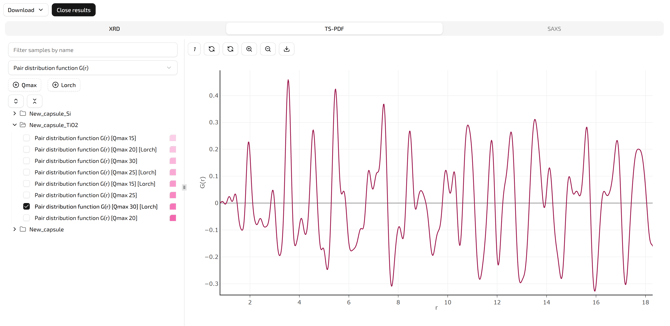
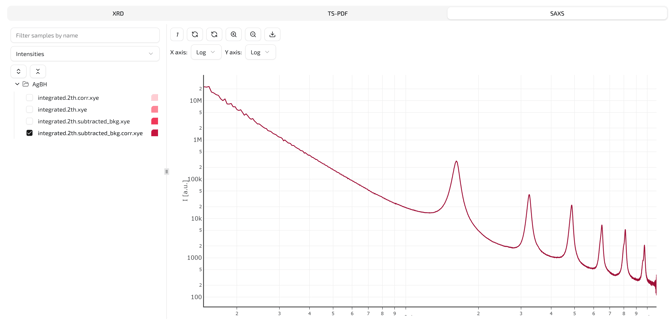
Plotting the SAXS data in log-log scale: